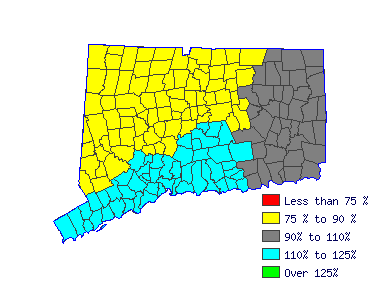
| Mean Wage History |
| Year | This Occupation | Compared to
Occupational Group | Difference |
| Current | $44976.61 | | $56417.22 |
| -$11440.61 |
| 2014 | $44757.92 | +.5% | $56142.91 |
+.5% | -$11384.98 |
| 2013 | $43919.62 | +1.9% | $55091.37 |
+1.9% | -$11171.74 |
| 2012 | $43081.32 | +1.9% | $54039.83 |
+1.9% | -$10958.50 |
| 2011 | $42243.02 | +2.0% | $52988.30 |
+2.0% | -$10745.27 |
| 2010 | $41586.96 | +1.6% | $52165.35 |
+1.6% | -$10578.39 |
| 2009 | $40858.01 | +1.8% | $51250.98 |
+1.8% | -$10392.96 |
| 2008 | $40420.63 | +1.1% | $50702.35 |
+1.1% | -$10281.71 |
| 2007 | $39217.85 | +3.1% | $49193.62 |
+3.1% | -$9975.76 |
| 2006 | $37905.73 | +3.5% | $47547.74 |
+3.5% | -$9642.00 |
| Year | This Occupation | Compared to
All Occupations | Difference |
| Current | $44976.61 | | $51120.02 |
| -$6143.41 |
| 2014 | $44757.92 | +.5% | $50703.05 |
+.8% | -$5945.13 |
| 2013 | $43919.62 | +1.9% | $49618.94 |
+2.2% | -$5699.31 |
| 2012 | $43081.32 | +1.9% | $48618.22 |
+2.1% | -$5536.90 |
| 2011 | $42243.02 | +2.0% | $47784.29 |
+1.7% | -$5541.26 |
| 2010 | $41586.96 | +1.6% | $47033.75 |
+1.6% | -$5446.79 |
| 2009 | $40858.01 | +1.8% | $46241.52 |
+1.7% | -$5383.51 |
| 2008 | $40420.63 | +1.1% | $45616.07 |
+1.4% | -$5195.43 |
| 2007 | $39217.85 | +3.1% | $44448.57 |
+2.6% | -$5230.71 |
| 2006 | $37905.73 | +3.5% | $43030.88 |
+3.3% | -$5125.14 |
|
Reference Date: 1st Quarter 2015 |
State of Connecticut Department of Labor Office of Research
200 Folly Brook Boulevard Wethersfield, CT 06109
Phone: 860-263-6285 |

| | | | |
| Top Areas For This Occupation |
|
|
|
 |


